Monday, March 9, 2015

The First Law of Thermodynamics (4th Day)

Spring 2015
Professor Mason
March, 5th

Pressure in Syringe
First of all, in the class, we did an experiment which includes a friction-less syringe, an empty beaker and a beaker filled with hot water. What we did was to measure the syringe's movement. With the room temperature surrounding the empty beaker, the top part of the syringe slides down slowly. On the other hand, when the empty beaker were surrounded by the hot water inside the other beaker, the top part of the syringe slides up slowly as the pressure makes the atom moves aggressively toward the edges of the empty beaker.


Work, Heat, and Energy


 The next things we learned in class was about work, heat, and energy. We use the symbol U for internal energy. During a change of state of the system, the internal energy may change from an initial value to a final value We denote the change in internal energy as deltaU = U2 - U1.
 In this case, work is equal to [Integral of P*dV] or [P*Vo*Beta*delta T]. P is also equal to [2/3 (N*K)/V]


Root Mean Square Velocity
 It is represented by the equation: Vrms =[squareroot of ((3*R*T)/m)] or [squareroot of ((3*Kb*T)/m)] , where Vrms is the root-mean-square of the velocity, m is the molar mass of the gas in kilograms per mole, R is the molar gas constant, Kb is Boltzmann constant, and T is the temperature in Kelvin. We found out that V total is equal to 3Vx by doing the magnitude of 3 Vs as showed from the picture above.

Fire Syringe


In class, we also did another experiment, which we used the tool called fire syringe. By pushing the plunger as quick as we can, the goal to avoid change in pressure as seen in the video below would succeed because we wanted to change volume without changing the pressure. The temperature increased rapidly when we did this. First before we started pushing the plunger, we needed to collect the data, such as the height of the syringe measured from the bottom where we placed the cotton at to the part where the plunger ends. Then, we make some calculations to predict the final temperature. The ignition point of cotton is about 210*C or 483K. After we got all the data, we started pushing the plunger as fast as we can in order to light up the cotton. Based on the calculation picture below, we found out the final temperature to be 2860.8K. Thus, the cotton did light up as shown in the video as well.

Inverse Curve Fit and Gas Laws (3rd Day)

Spring 2015
Professor Mason
March, 3rd

Pressure and Volume Change of Water in Can
This morning, we did an experiment which involved a can filled with hot boiling water and a beaker filled with cold water. The experiment was to place the can upside down into the cold water and see how it would react. The result was the water inside the can rapidly imploded due to extreme difference in temperature; therefore, the can was crushed.


Then, after we did the experiment with the can filled with boiling water, we did another experiment. This experiment involves a heated empty can (only filled with air). The process was the same; we, as well, place the heated empty can upside down into the cold water. The result was nothing happened to the can; however, the cold water was pulled into the can after a few seconds.  It looks like this:


Ideal Gas Law
In class, professor Mason set up three beaker glass: one filled with cold water, one filled with hot water, and the other one was filled with room temperature water. The first graph was Pressure (kPa) vs Temperature (C), which is linear fit.

There is also an experiment which involves the no friction syringe. The graph looks similar to Pressure vs Temperature graph, which is linear fit.


An ideal gas can be divided by three variables: pressure (P), volume (V), and temperature (T). The calculations for Ideal Gas Law are:
PV = nRT = NkT
n = number of moles
R = universal gas constant = 8.3145 J/mol K
N = number of molecules
k = Boltzmann constant = 1.38066 x 10e^-23 J/K = 8.617385 x 10e^-5 eV/K
k = R/NA
NA = Avogadro's number = 6.0221 x 10e^23 /mol

Other than PV = nRT = NkT formula, there is also a formula which include [(P1*V1)/T1 = (P2*V2)/T2].  These are the examples we did in class.

The other form of ideal gas law is the statistical mechanics. P = n*Kb*T. P is the absolute pressure of the gas measured in pascals, n is the number density in the gas measured in 1/(meters cubed), Kb is the Boltzmann constant relating temperature and energy, and T is the absolute temperature. The number density can also be applied to the other formula, which uses N, the number of moles and V, the volume, which leads to R = Na*Kb where Na is Avogadro's constant.


Pressure vs Volume

In class, we did an experiment of Pressure vs Volume, which involves a tool that can manipulate the pressure inside the glass. The pictures and videos above are the examples of our experiment. First off, we started with the balloon; we put the balloon inside the glass and started with taking out all the pressure inside the glass. As a result, the balloon inflated because there is no pressure that kept the balloon from inflating. On the other hand, when we put the pressure back in, the balloon deflated because there is pressure that keeps the balloon from getting bigger. A simple example is like sponge being crushed by hand; it means that the sponge is receiving pressure from outside.

After we finished experimenting with the balloon, we did the next one which was marshmallows. It works almost the same like balloons did. The marshmallow went bigger when the pressure inside the glass was taken out. However, the difference is when the marshmallows is receiving the pressures back; it does not return back to normal like the balloon did, but it got smaller than the original ones.

Boyle's Law (syringe)
Another experiment that we also did in class was Boyle's law, which involves a syringe, Logger Pro, and pressure sensor. The goal of this experiment is to obtain measurements by trapping a volume of air in the syringe and then compress the air slowly to smaller volumes by pushing the plunger. This is how we set up on Logger Pro.

After we set it up on logger pro, we pressed collect in order to know how to graph will look like by pushing the plunger slowly after we pressed the collect button. These pictures below are how the graph look like.


We also made a prediction of these graph  beforehand; and this is how the prediction looks like before we did it on logger pro.


Monday, March 2, 2015

Thermal Expansion, Specific Heat, Pressure, and Latent Heat of Fusion and Vaporization (2nd Day)

Spring 2015

Professor Mason

February 26th

Heated Ring
This morning, we were given a ring to be heated, and we need to look at the hole whether it got smaller, bigger, or nothing happened. After we did the experiment, we found out that the hole of the ring got bigger after being heated. 

Thermal Expansion
The next thing we did was thermal expansion. In order to find the thermal expansion (alpha), we needed to find the arc length of the circle first as stated below.


After we found the L, which is [(diameter/2) * theta] ((theta is the angle)), next we use this converted L to the thermal expansion formula, which looked like the pictures above.

Bi-metal Strip
Another experiment that we did was bi-metal strip. We heated the strip to see how it would be looked like after we heated it. The strip looks like this:
At first, we had to predict how it would become if we heated the brass side and the invar side. The strip bent toward the invar side when we heated the brass side, as well as when we heated the invar side. This happened because the brass inductive. Next, after we heated it, the other experiment wanted us to put the strip in a bucket of ice. As a result, the strip bent toward the brass side. 

Latent Heat
There are two types of latent heat that we learned in class, and those are latent heat of fusion (Lf) and latent heat of vaporization (Lv). Those two types of latent heat can be found by looking it up on the internet. Those are used in a formula when a phase happens, such as melting and vaporizing.


 Errors
There are three types of error that we learned in this morning class, and those are: Systematic error, Random error, and Catastrophic error.

Pressure
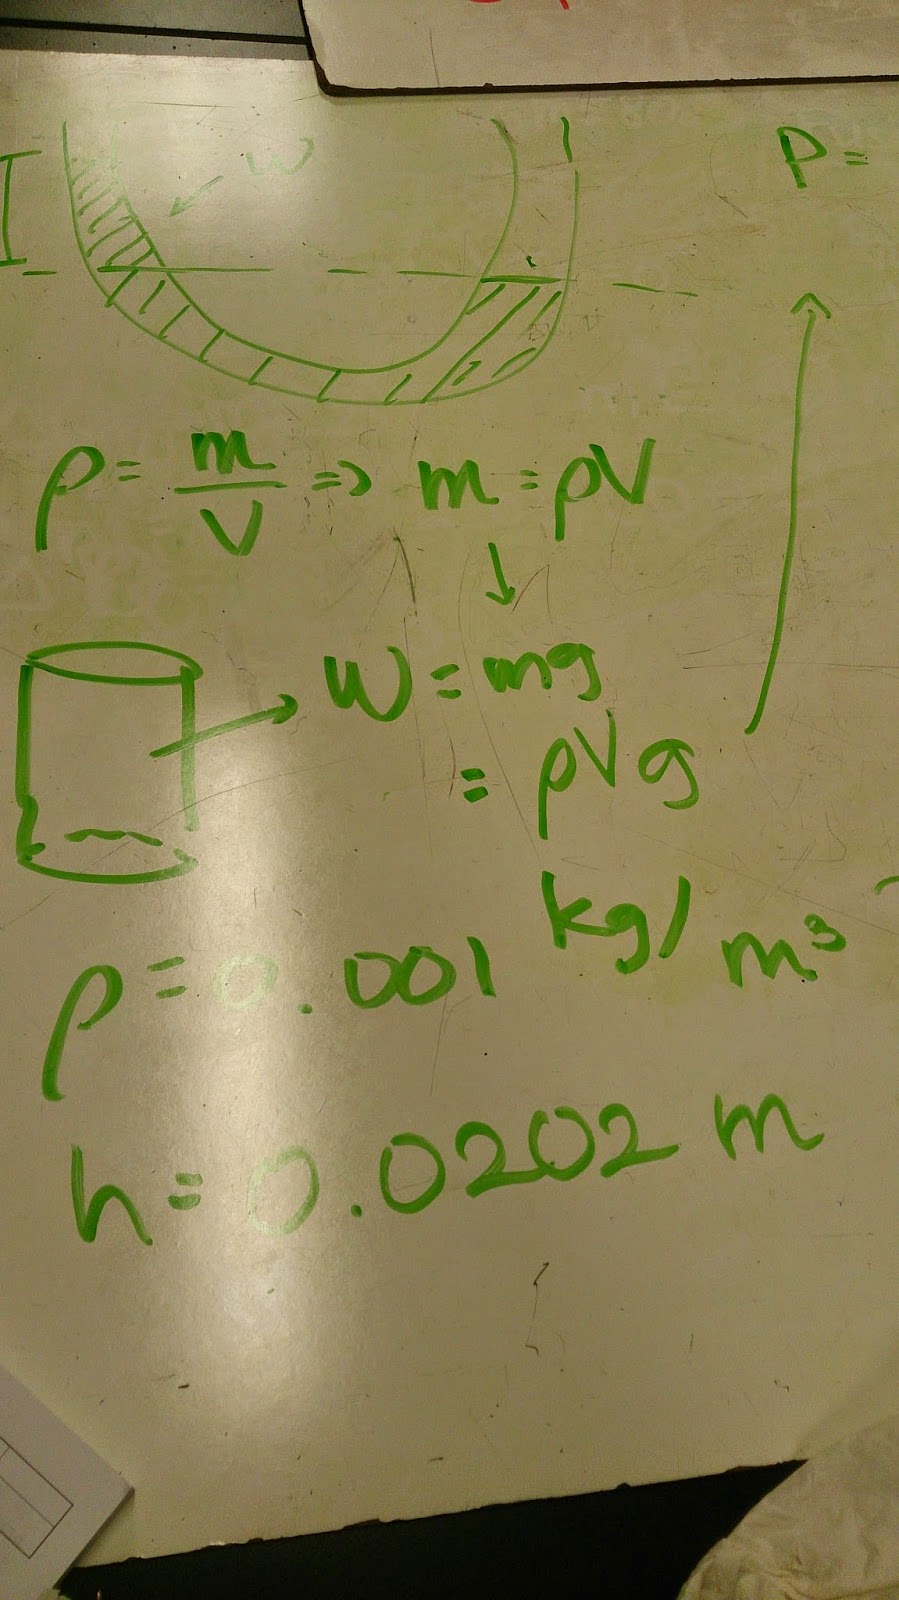
Pressure or Power (P) has a formula, and it looks like P = rho g h. It involves density (rho), gravity (g), and height (h). Density (rho) is m/v, which m is mass and v is volume. These are the ones we did before.

The attached video below is our experiment before with manometer tube:

As we can see from the pictures and the videos above, we found out that the height (y) of the water changed. The one end of the straw has its water risen, while the other end has its water decreased. The change in level of water is directly proportional to pressure put into the system. After the experiment, we also found out that the change of the height is about 2.02 cm.
In addition, we found out that [rho * g * h] comes from [P=F/A] => [(rho * v * g)/ A] => [(rho*A*h*g)/A].

Heating Water Experiment
This experiment is about having a container that has a mixture of ice and water at 0 degree Celsius. Then, we started heating it at a constant rate and the water starts boiling after 5 minutes. We were supposed to predict on how the graph would look like, however, our predictions were way off. Therefore, this picture below is how the correct graph actually looks like:

Heat Transfer and Energy Exchange (1st Day)

Spring 2015

Professor Mason

February 24th

Fahrenheit/Celsius/Kelvin
In this class, we discussed heat transfer and energy exchange. First, we discussed about temperature (in Celsius, Kelvin, and Fahrenheit). There are certain formulas for each one of those.

After that, we calculated x, which was the number converted from Fahrenheit to Celsius (based on the picture above). Based on the numbers we all got in class, we calculated the uncertainty of those numbers, and from what we have gotten, the difference was not too high.

Heat Energy
Next, we discussed about heat (Q) which led us to a formula: Q = mc(delta T). This formula we used was applied to water, and it involved the temperature of water (T), mass of water (m), and the specific heat (c). Here are the examples that we did in class:


Heat Flow and Heat Rate
We also discussed heat rate (dQ/dt) which made us think about a formula: dQ/dt = [kA (delta T)]/L. This formula involves conductivity (k), surface area (A), temperature difference (delta T), and length (L). We applied this formula to copper and aluminum bar example. First, we had to find the Q based on: 
 The picture above is heat flow. Heat flow is the heat going through a material per second (J/s OR Watt). We used heat flow formula in order to move on to the next problem, which was:
Graph
The next thing we did was the graphs. Below are the pictures of the graphs that we took in class, including equilibrium temperature and heat versus temperature: