Spring 2015
Professor Mason
February 26th
Heated Ring
This morning, we were given a ring to be heated, and we need to look at the hole whether it got smaller, bigger, or nothing happened. After we did the experiment, we found out that the hole of the ring got bigger after being heated.
Thermal Expansion
The next thing we did was thermal expansion. In order to find the thermal expansion (alpha), we needed to find the arc length of the circle first as stated below.


After we found the L, which is [(diameter/2) * theta] ((theta is the angle)), next we use this converted L to the thermal expansion formula, which looked like the pictures above.
Bi-metal Strip
Another experiment that we did was bi-metal strip. We heated the strip to see how it would be looked like after we heated it. The strip looks like this:
At first, we had to predict how it would become if we heated the brass side and the invar side. The strip bent toward the invar side when we heated the brass side, as well as when we heated the invar side. This happened because the brass inductive. Next, after we heated it, the other experiment wanted us to put the strip in a bucket of ice. As a result, the strip bent toward the brass side.
 There are two types of latent heat that we learned in class, and those are latent heat of fusion (Lf) and latent heat of vaporization (Lv). Those two types of latent heat can be found by looking it up on the internet. Those are used in a formula when a phase happens, such as melting and vaporizing.
Errors
There are three types of error that we learned in this morning class, and those are: Systematic error, Random error, and Catastrophic error.

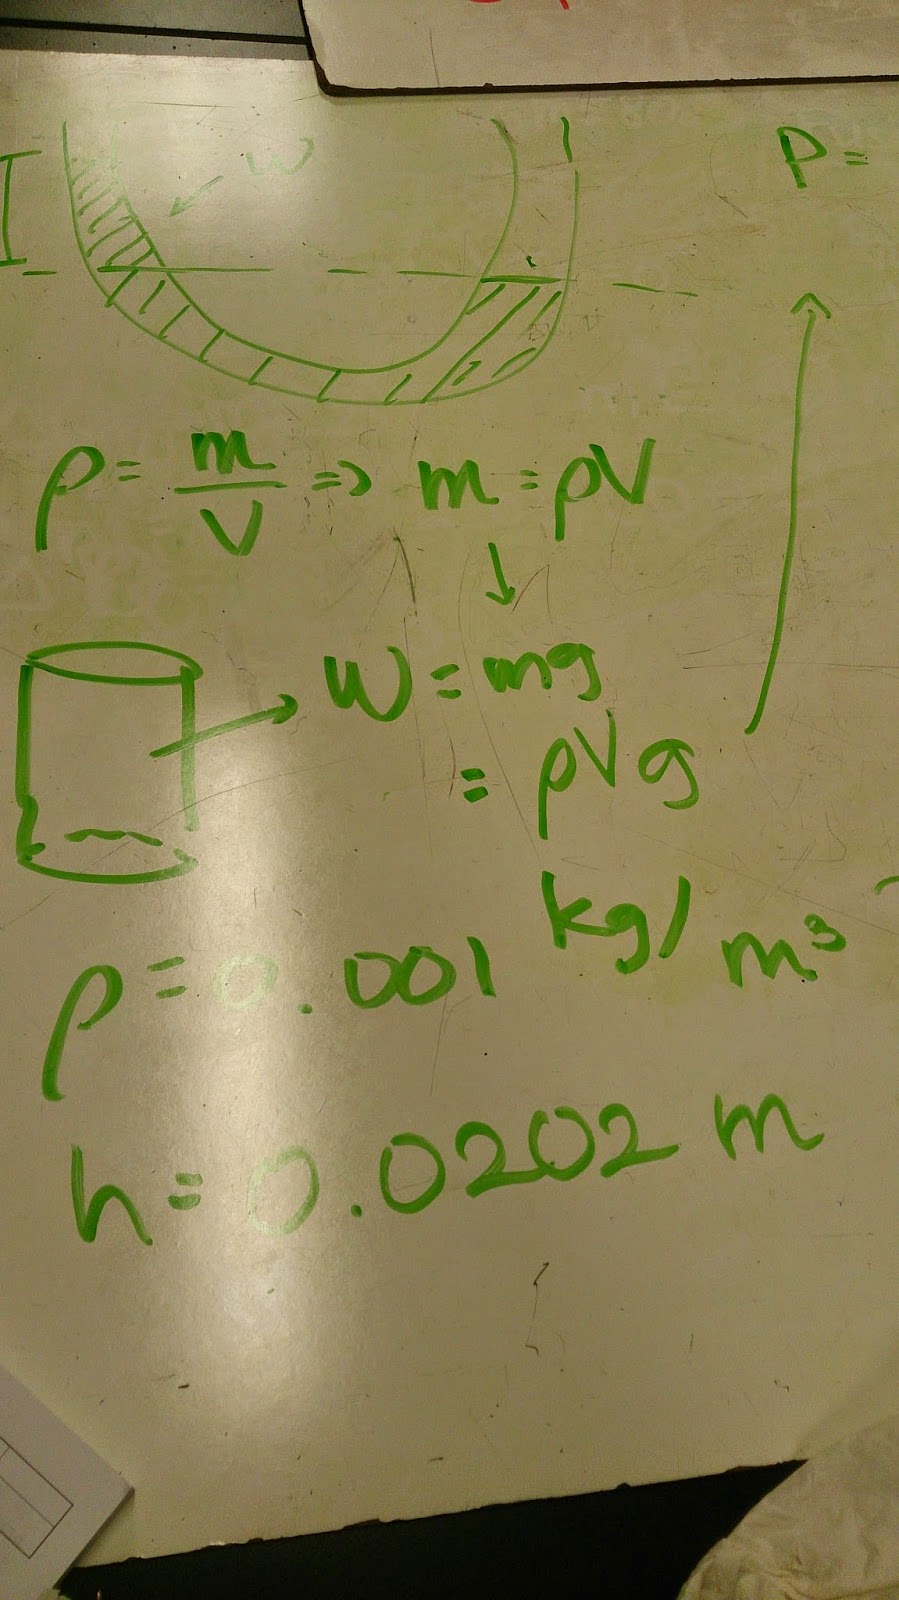
 Pressure or Power (P) has a formula, and it looks like P = rho g h. It involves density (rho), gravity (g), and height (h). Density (rho) is m/v, which m is mass and v is volume. These are the ones we did before.
The attached video below is our experiment before with manometer tube:
In addition, we found out that [rho * g * h] comes from [P=F/A] => [(rho * v * g)/ A] => [(rho*A*h*g)/A].
Heating Water Experiment
This experiment is about having a container that has a mixture of ice and water at 0 degree Celsius. Then, we started heating it at a constant rate and the water starts boiling after 5 minutes. We were supposed to predict on how the graph would look like, however, our predictions were way off. Therefore, this picture below is how the correct graph actually looks like:
This experiment is about having a container that has a mixture of ice and water at 0 degree Celsius. Then, we started heating it at a constant rate and the water starts boiling after 5 minutes. We were supposed to predict on how the graph would look like, however, our predictions were way off. Therefore, this picture below is how the correct graph actually looks like:


No comments:
Post a Comment