Professor Mason
June 2 Class
Formulas used in AC circuit experiment
The first thing we did in class was about reviewing the formulas and equations that we were going to use for the rest of the class including [Xc = 1/wC], [Xl = wL], [Vrms = Irms Z], [z = sqrt of R^2 + (Xl - Xc)^2. Moreover, if the Xl is zero, the circuit becomes like the one drawn in the picture attached on the left, which has an equation of [z = sqrt of R^2 + Xc^2]; therefore, we can say that [Vrms = (sqrt of R^2 + Xc^2) Irms]. As shown in the picture attached on the left, we can also say that [Irms = Vmax/ (sqrt 2) (sqrt R^2 + (1/wC)^2)]. In class, professor asked us what would happen to Irms if the frequency is doubled; the answer to that question is the Irms would be four times bigger because of the equation [w = 2 pi f] and [Xc = 1/wC].
Circuit experiment on Logger Pro
In class, we needed to do an experiment about AC circuit, and we were given things, such as 100 uF Capacitor, 10 Ohm resistor, Function generator set at 10Hz and 1000Hz, and motion detector set on logger pro. We first needed to do the 10Hz frequency set on function generator; next, we needed to do the 1000Hz frequency set on function generator. We also set 1V as the voltage max on the function generator. The setup is shown in the picture attached above; while the graph of Current vs time and Voltage vs time shown in the picture attached below. We needed to attach the current censor series to function generator and capacitor, and we also needed to attach the voltage probe to the function generator for both positive and negative charges. We needed to set the first one on 5000 samples and measured for 0.5 seconds; the maximum samples we could do was 5000 samples only because we set up 2 censors (voltage probe and current censors) at the same time in order to make the graph looks more smoother (not sharp).

We still needed to do the next experiment, which was dealing with 1000 Hz frequency set on function generator. For this one, we needed to set the data samples on 0.01 seconds with 50000 samples in order to make the graphs look smoother instead of sharp looking graph. This time, we could set the data samples on 50000 samples because we only had 1 censor at a time, and it must be attached to CH1 on the motion detector, otherwise, it would not work. We needed to use only 1 censor at a time because if we used two censors instead, we could only collect 5000 samples, which would not produce a smooth graph on Logger Pro. The Voltage vs time graph is shown on the picture attached above; the current vs time graph is shown in the picture attached below.
After we finished with the experiment, we needed to measure the experimental Vmax, Imax, Vrms, and Irms as well as theoretical impedance, Vrms, and Irms. This time, we could use multi meter in order to measure the experimental Irms and Vrms on the circuit.
Experiment and Calculations on 10 Hz and 100 Hz frequencies
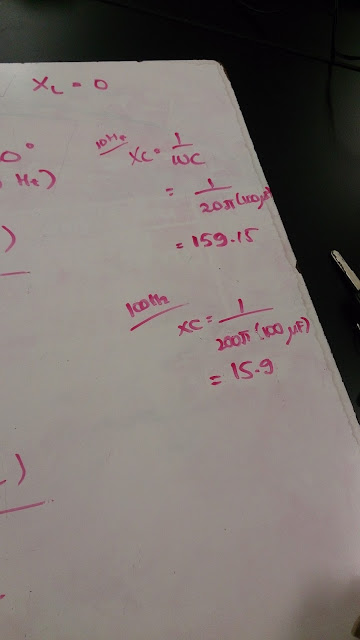
Next, we had to do another experiment, but the differences were the frequencies we used. For this experiment, we had to use 10 Hz for the first experiment, then 100 Hz experiment for the next one. After were done setting all up on the Logger Pro, we needed to measure the experimental phase difference by measuring the difference of times between the Max current graph and Max voltage graph divided by the period, which has an equation of [T = 1/f] on Logger Pro. The phase angle has an equation of [Phase angle = Phase diff * 360 degree]; we needed to do both for 10 Hz and 100 Hz frequencies in order to get the experimental calculations. The answers are shown in the pictures attached on the top left, and middle left.
After we finished with the experimental calculations, we moved on to theoretical calculations. Theoretical calculations have an equation of [Phase angle = tan (theta) = (Xl - Xc)/R] by using the calculations calculated above. After we finished doing the calculations and experiments for phase difference and phase angle, we continued on doing resonance in RLC circuits. In class, professor showed us the graph of I that becomes Imax when Xc = Xl shown in the picture attached on the left; the top one is called the resonance peak. We were provided a formula for this kind of problem, which is [fo = 1/ 2pi(sqrtLC)], which fo is the resonance frequency.
Next, we needed to predict a circuit based on what the professor said in class and drew it on the board; it is shown in the picture attached on the left. In this calculation, we first needed to find the f based on Imax using the given formula on the above; then, we needed to calculate the power average, which has an equation of [Pavg = 1/2 (z I^2max cos(theta))], which cos(theta) here is defined as power factor. The works are shown in the picture attached on the left.
Based on the predicted circuit as shown in the picture attached before, the setup of the real circuit is shown in the picture attached above. Then, we needed to find for the right or maximum frequencies with multi meter and function generator.
The steps for this experiments are: set everything up in series, watch current in multi meter, tweak the frequency in function generator, find the range where the current reach its peak on multi meter, get the average of the frequencies, and finally, the obtained value is the resonance frequency shown in the function generator. Therefore, we basically were looking for the right frequency based on the measured current in multi meter.


No comments:
Post a Comment